


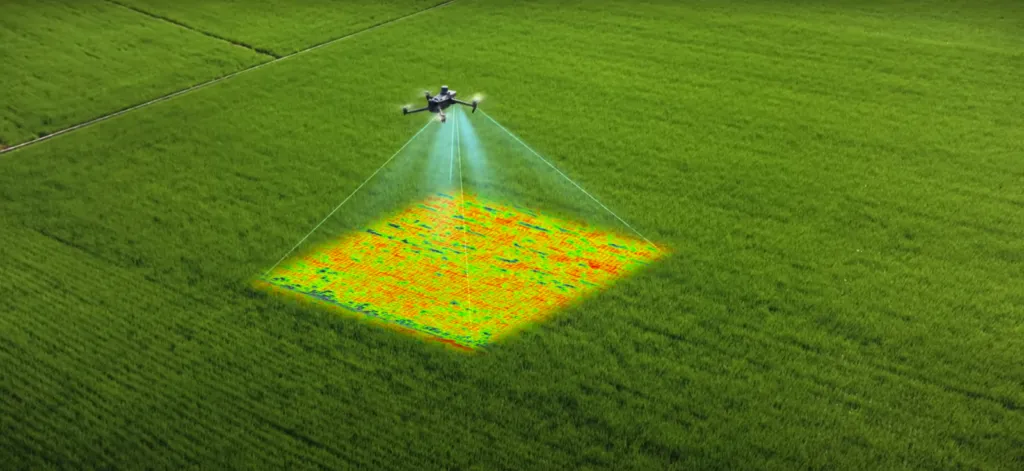
Solution · Multispectral Imaging
See crop stress beforethe human eye can
Multispectral drone surveys, NDVI and NDRE crop health mapping, variable-rate prescriptions and drone spraying for farms, date palm plantations and estates across Dubai, Abu Dhabi, the UAE and the wider GCC.
The Challenge
Yield lost before you see it
Crop stress is invisible until damage is done, irrigation runs on guesswork, and hectares are too large to walk. In UAE conditions, every day of undetected stress costs yield.
The Solution
Plant-level intelligence from the air
Multispectral sensors capture reflectance bands the eye can't see. NDVI and stress indices flag problem zones days or weeks before visual symptoms, while intervention still pays.
Watch
Multispectral, explained
See how multispectral capture turns invisible plant stress into decisions you can act on.
Applications
Where multispectral pays for itself
NDVI Crop Health
Vegetation vigour mapping across whole farms: updated per flight, comparable over time.
Irrigation Planning
Moisture stress zones drive precision irrigation: water where it's needed, not everywhere.
Pest & Disease Early Warning
Anomaly clusters flag outbreaks before they spread across the field.
Environmental Monitoring
Vegetation analysis for environmental compliance and land management.
Fertilisation Zoning
Variable-rate application maps that cut input costs and lift yield consistency.
Seasonal Benchmarking
Season-over-season comparison to measure what actually worked.
Precision irrigation
Water by zone, not by field
One irrigation setting across a whole block averages out the variation inside it. Some zones take more water than they need; others stay under-watered and quietly lose yield.
Moisture-stress mapping splits the block into zones and gives each one its own rate, so water goes exactly where the data says it is needed. In UAE conditions, where water is the most expensive input on the farm, that difference compounds every week of the season.
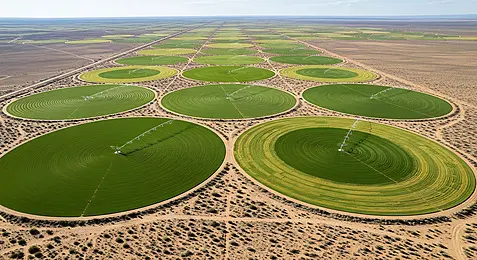
Water applied by zone, not by field: exactly what the moisture-stress data calls for.
01 · How it works
Five spectral bands, captured in a single pass
A multispectral drone does not take one photograph. It records reflected light in several narrow bands at once: including near-infrared and red edge, which the human eye cannot see. Plants reflect those bands differently depending on chlorophyll content, cell structure and water status, so a stressed plant looks measurably different long before it looks different to a person standing in the field.
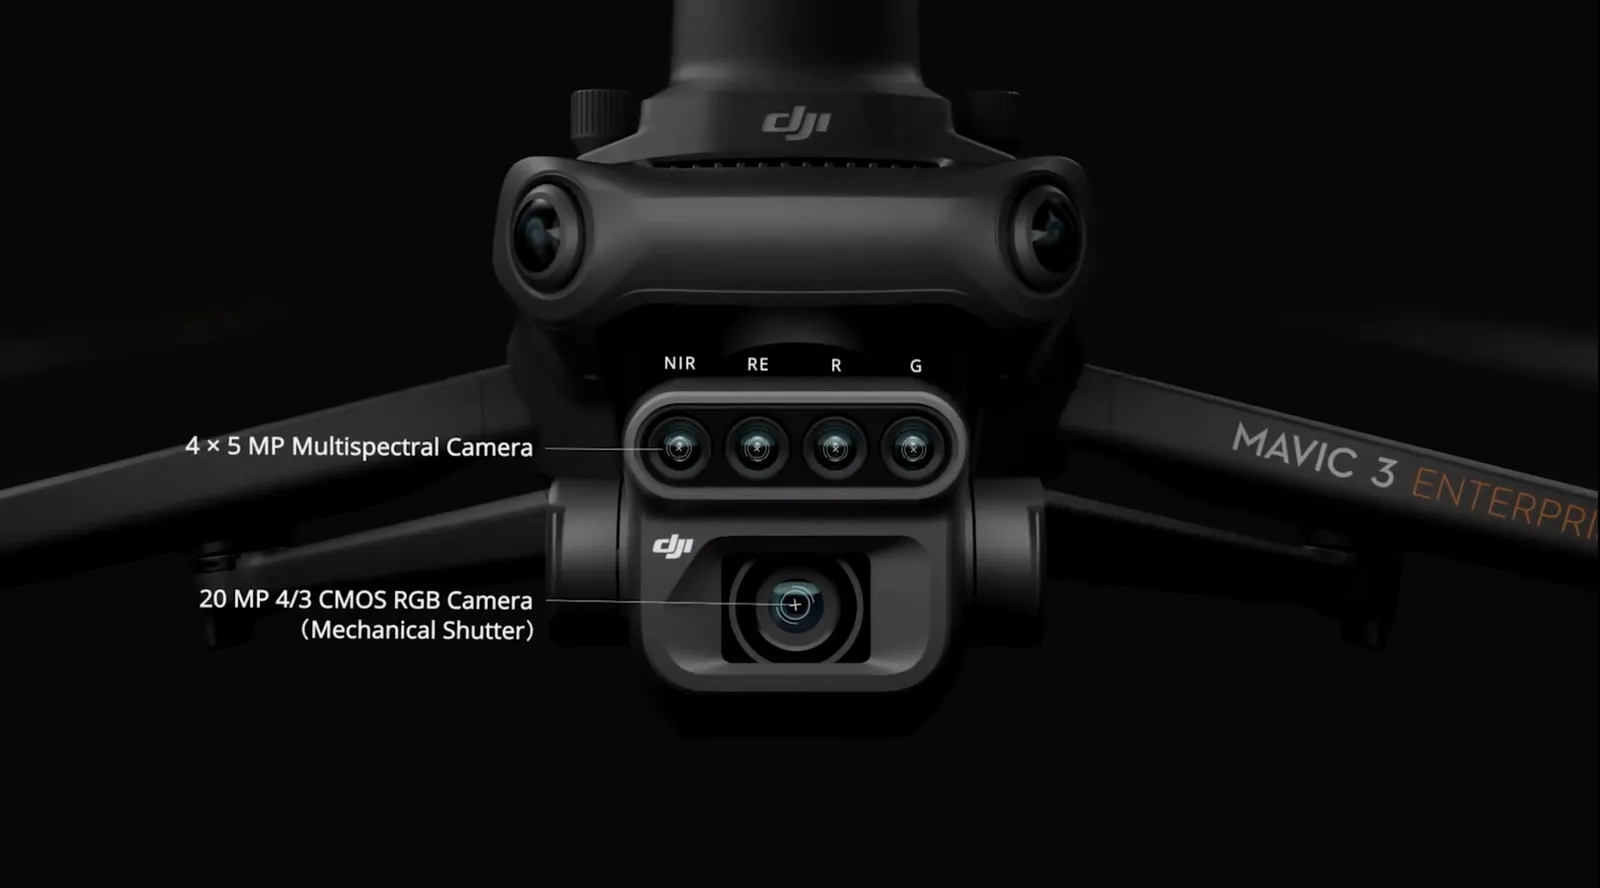
The survey aircraft carries a 4×5 MP multispectral array, green, red, red edge and near-infrared, plus a 20 MP RGB camera, all exposed simultaneously so every band aligns to the same instant and the same ground position.
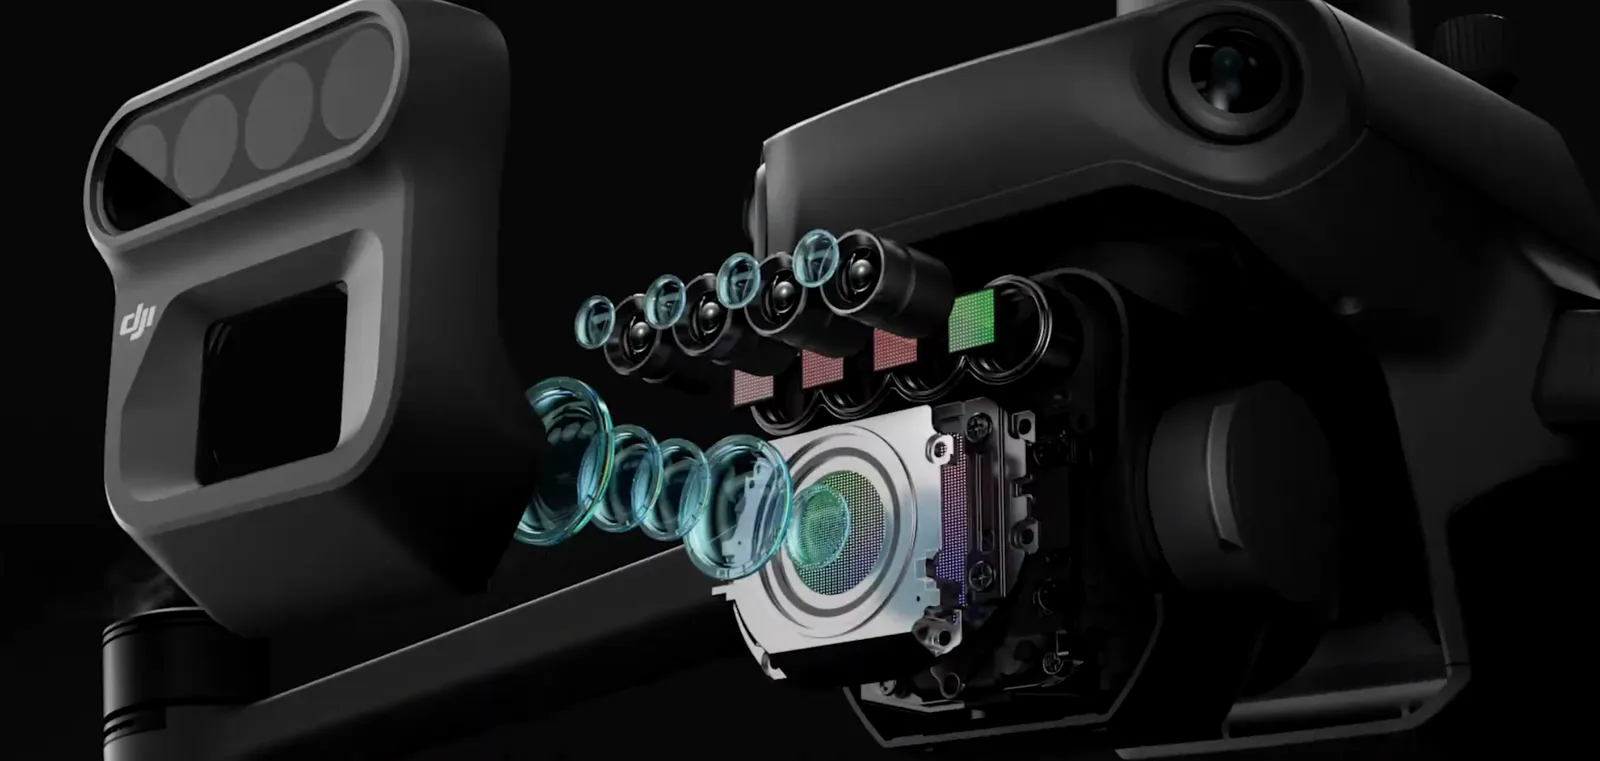
Each band has its own optical path and filter. A sunlight sensor records ambient irradiance during the flight so readings are calibrated for cloud and time of day, which is what makes one survey genuinely comparable to the next.
02 · Index library
One flight, five diagnostic layers
The same capture is processed into several vegetation indices. Each answers a different agronomic question, and reading them against one another is what separates a real diagnosis from a colourful picture. The maps below are from a live AIN UAE survey.
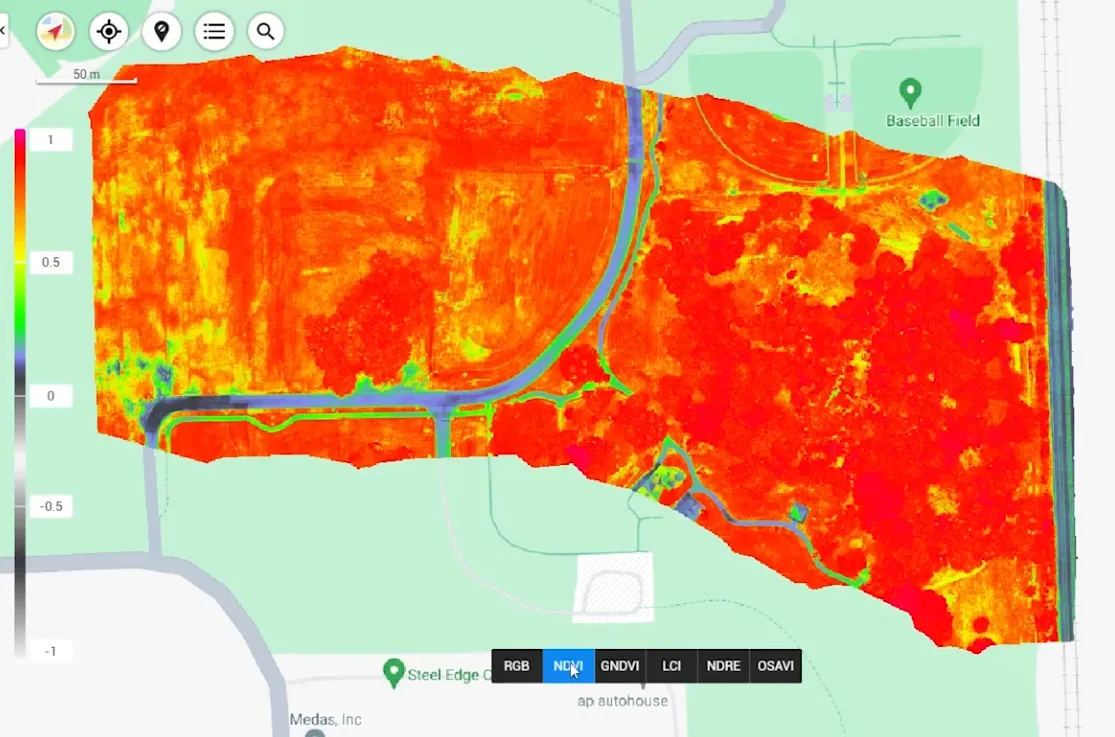
The standard canopy health read. Broad, reliable and widely understood, but it can overstate health where bare soil reflects between plants.
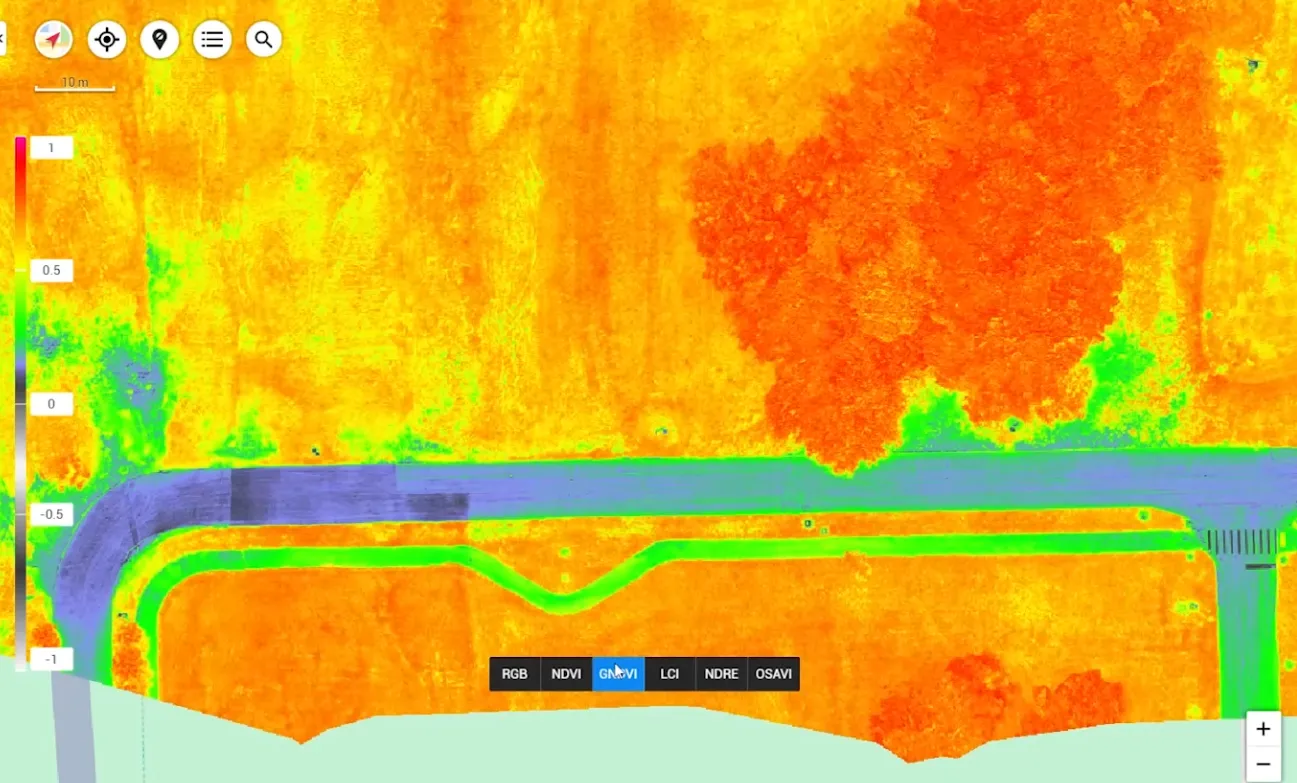
More sensitive to chlorophyll concentration than NDVI. Used to judge photosynthetic capacity and to compare managed areas against unmanaged margins.
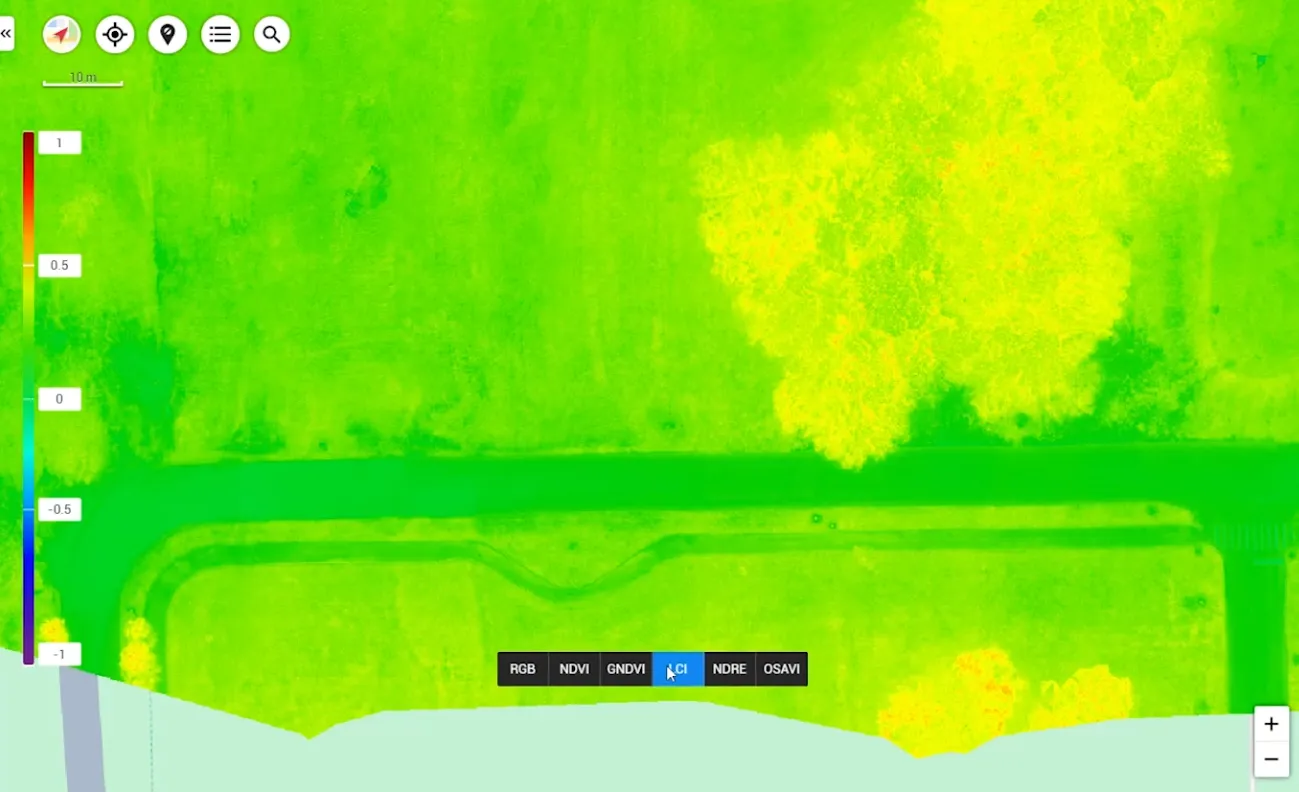
Reads inside the canopy rather than across its surface. Trees and shrubs that look healthy from above frequently show their real condition here first.
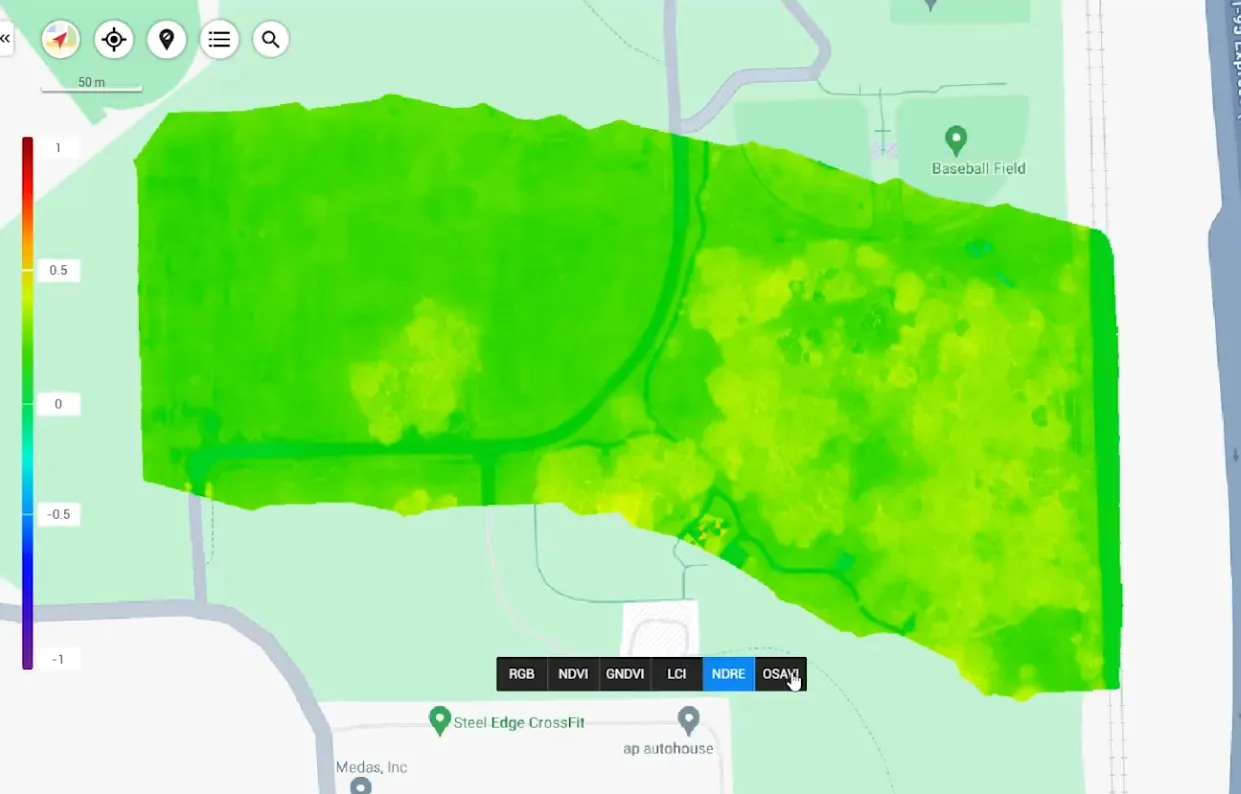
The red-edge band penetrates dense canopy, making this the working index for nitrogen management and for mature crops where NDVI saturates.
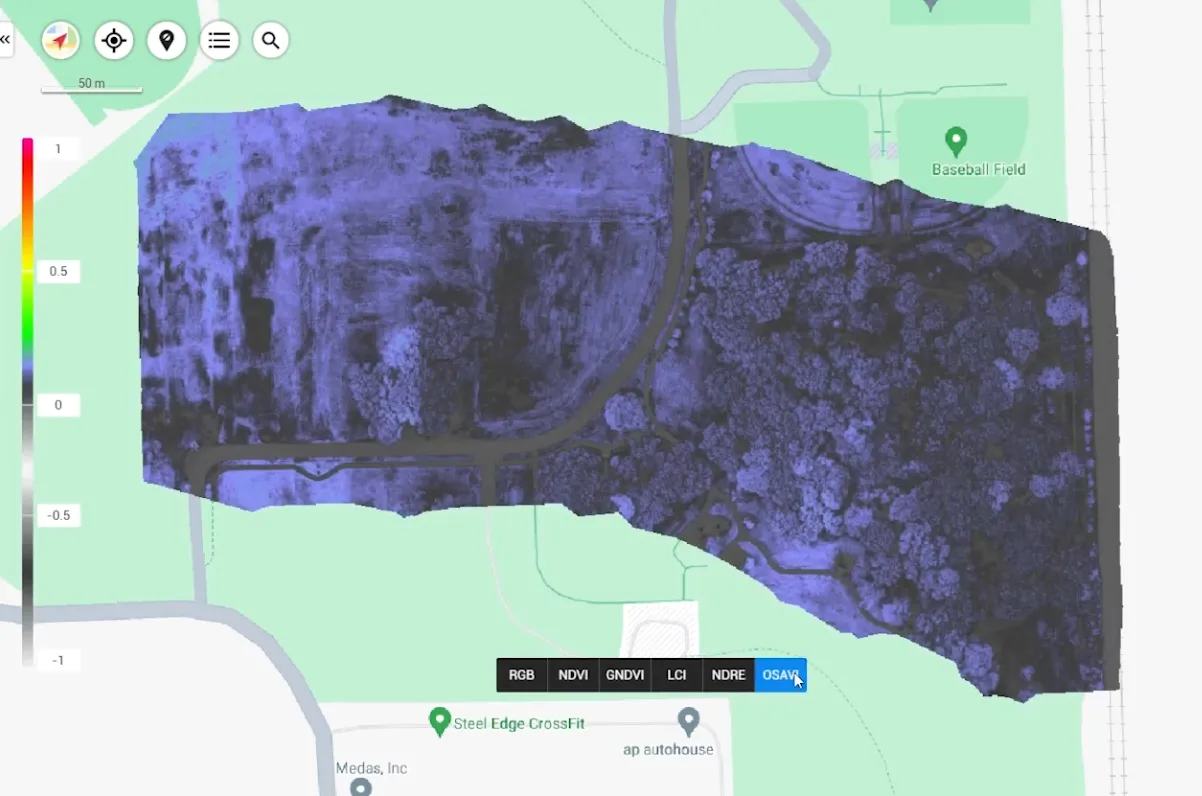
Mathematically removes soil background. On patchy ground this is the honest density read, and it routinely contradicts a flattering NDVI result.
Why five and not one
A single index can mislead. Agreement between layers raises confidence; disagreement is itself the finding. A zone reading high on GNDVI but low on LCI is the classic signature of a plant that looks well on the surface and is struggling underneath.
03 · Agronomic value
What multispectral data actually solves
Nine operational problems that aerial spectral data addresses directly for growers, agronomists and estate managers across the UAE and wider GCC.
Precision farming
Detailed crop maps expose in-field variability, so irrigation, fertilisation and pesticide application can be tailored zone by zone instead of applied uniformly. Resource efficiency rises, input cost falls, and yield becomes more consistent across the block.
Timely decision-making
Index maps are available in near real time. If a disease outbreak or irrigation failure appears in the data, action can be taken the same week rather than after the next scheduled inspection.
Reduced labour and time
Manual scouting is slow and labour-intensive. A drone covers a large holding in a single flight, freeing agronomy staff to act on findings rather than spend the day walking rows to generate them.
Non-destructive assessment
Crops are measured without being touched. Nothing is trampled, sampled or disturbed, which matters for fragile or high-value plantings, and removes the risk of spreading disease or pests by foot traffic between blocks.
Early problem detection
Spectral indices register physiological stress before symptoms are visible to the eye. That lead time is the difference between a treatable zone and a lost one.
Data integration
Spectral layers combine with soil sampling, irrigation records and weather data to give a single view of the holding, supporting both immediate intervention and long-term agronomic planning.
Environmental performance
Applying water, fertiliser and chemistry only where the data shows a need reduces over-application and runoff: a direct contribution to sustainable production and to UAE water-security objectives.
Insurance and documentation
Geo-referenced, date-stamped imagery forms an evidence record of field condition. In a damage or loss event, that record supports an insurance claim far better than photographs taken after the fact.
Research and development
Consistent, repeatable spectral capture lets research teams and agri-tech firms measure how varieties and treatments actually respond in local conditions, across seasons and trial plots.
05 · Case study
Crop health diagnostic summary
An anonymised extract from a delivered AIN UAE survey report, showing how the five-index method reads a field that looks healthy from the air.
Multispectral crop health · diagnostic summary
Multi-index vegetation assessment · NDVI · GNDVI · LCI · NDRE · OSAVI
Executive summary
A survey of a 4–6 hectare turf and landscape site captured five vegetation indices. Cross-referencing them showed the field was underperforming relative to its visual appearance: NDVI overstated health, nitrogen was unevenly distributed, turf density was thinner than it looked, and a high-value tree and shrub cluster was showing early internal stress. Targeted intervention was recommended within 7–14 days.
Overall agronomic assessment
Nitrogen distribution uneven, turf density below optimal, and the upper-right tree and shrub zone showing early internal canopy stress despite a healthy surface appearance.
Five-index findings
Orange-red tones read as healthy, but the signal was inflated by bare soil reflectance between plants.
The broad field ran at roughly 60–70% of its potential. Unmanaged road-edge grass outperformed the managed field.
The tree and shrub cluster, which scored high on GNDVI, was lowest on this index: the signature of internal stress beneath a healthy surface.
Deficiency clusters concentrated across the right half of the field rather than distributed evenly.
With soil background removed, turf coverage proved thinner and patchier than NDVI had suggested.
Immediate priorities · 7 days
- CriticalArborist inspection of the upper-right tree and shrub cluster, following the LCI versus GNDVI divergence.
- CriticalGround-truth inspection of the left road intersection, where all indices read near zero.
- HighPenetrometer and root core sampling at five GPS-marked NDRE deficiency clusters.
- HighPhysical turf density count across the OSAVI blue-purple zones.
Methodology
Five simultaneous spectral bands, blue, green, red, red edge and near-infrared, processed into geo-referenced index maps and cross-referenced for agronomic interpretation. Findings are issued with GPS-marked inspection points so every recommendation can be located on the ground.
Request a survey of your holdingExtract published with client details removed. Survey area, findings and imagery are from a delivered AIN UAE project; the client, location and coordinates are withheld under confidentiality.
Free download
Get the full field diagnostic one-pager
The complete five-index breakdown — NDVI, GNDVI, LCI, NDRE and OSAVI — with the per-zone findings and the prescription actions, as a printable PDF. Enter your email and it downloads straight away.
FAQ
Common questions
Most operators fly bi-weekly during active growth stages and monthly otherwise. AIN UAE recommends a cadence based on crop type, growth stage and season.
NDVI and stress-index maps, zone shapefiles for variable-rate irrigation and fertilisation equipment, and an agronomist-readable report for every flight.
Yes. Palm plantations, field crops, forage and landscaping assets are all regularly monitored with multispectral sensors in UAE growing conditions.
NDVI is the baseline canopy vigour index but can be inflated by bare soil. GNDVI is more sensitive to chlorophyll concentration. LCI reads inside the canopy rather than across its surface, exposing internal stress. NDRE uses the red edge band to penetrate dense canopy and is the working index for nitrogen management. OSAVI mathematically removes soil background to give a true density read. AIN UAE processes all five from a single flight because agreement between them raises confidence, and disagreement between them is often the actual finding.
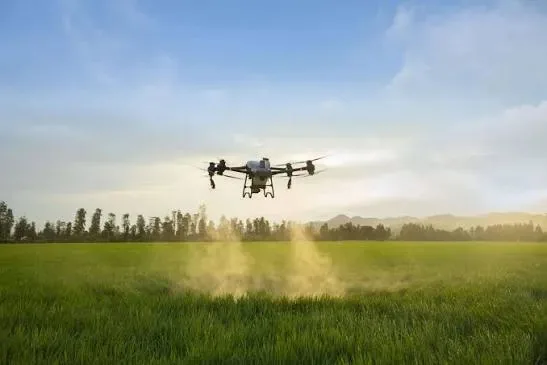
Yes. AIN UAE converts survey findings into a variable-rate prescription map, which is then executed as a routed spray mission using a DJI Agras T50 agricultural drone. Output is varied by zone, so treatment is applied where the spectral data identified a need rather than uniformly across the whole field.
Spectral indices register physiological change before symptoms become visible to the eye, typically giving days to weeks of lead time depending on crop, stress type and growth stage. That lead time is what allows an affected zone to be treated rather than written off.
Ready to see your asset in data?
Book a free consultation. GCAA & DCAA licensed. We respond within 24 hours.